3-Month Treasury Yield Curve & 2025: Insider Economic Outlook

Anúncios
The 3-month Treasury yield curve is a pivotal economic barometer, with its inversions historically preceding recessions, making its 2025 implications a critical focus for investors and policymakers alike.
Anúncios
Understanding the 3-month Treasury yield curve and its 2025 implications is not merely an academic exercise; it’s a vital component of informed decision-making for investors, businesses, and policymakers alike. This often-overlooked indicator holds a remarkable track record for predicting economic shifts, making its current trajectory and future signals paramount to deciphering what lies ahead for the US economy.
Decoding the 3-Month Treasury Yield Curve
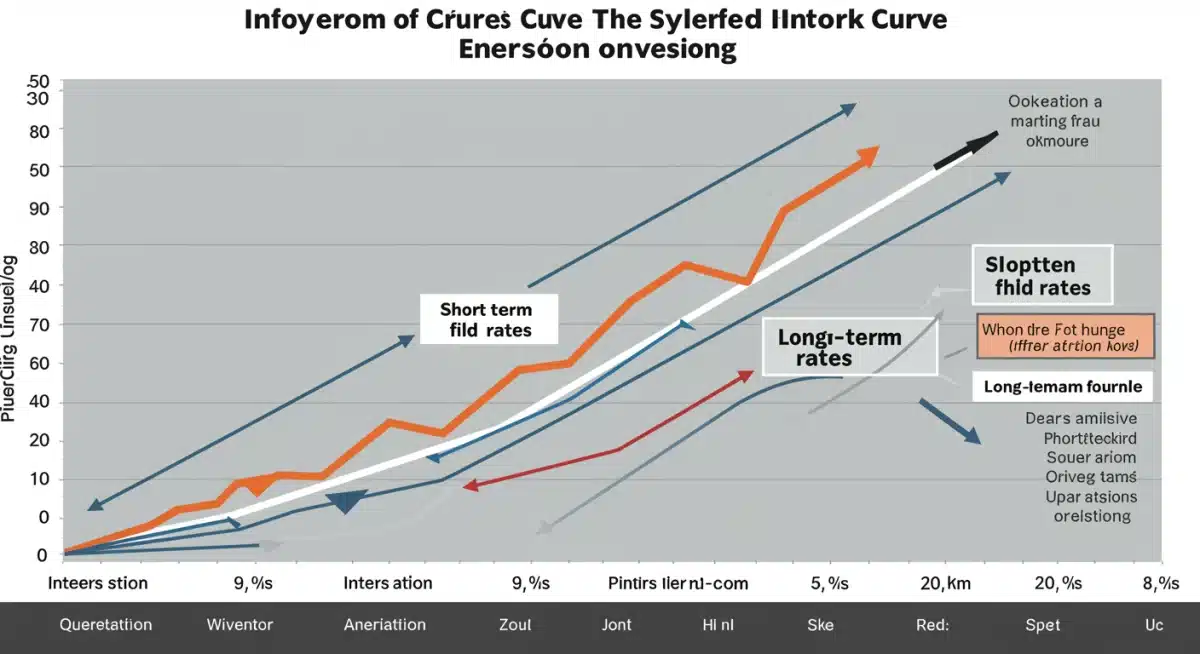
The 3-month Treasury yield curve represents the difference in interest rates between short-term (3-month) and long-term (e.g., 10-year) U.S. Treasury bonds. Typically, longer-term bonds offer higher yields to compensate investors for the increased risk and uncertainty associated with tying up their money for extended periods. This creates an upward-sloping yield curve, indicative of a healthy and growing economy.
Anúncios
However, when short-term yields exceed long-term yields, the curve ‘inverts.’ This inversion is a phenomenon that has historically preceded nearly every U.S. recession, often by 6 to 18 months. It suggests that investors anticipate future economic weakness, prompting them to demand less compensation for long-term debt, or that the Federal Reserve is tightening monetary policy aggressively, making short-term borrowing more expensive.
The Mechanics of Yield Curve Inversion
An inverted yield curve signifies a market expectation of future economic deceleration or recession. This occurs when:
- The Federal Reserve raises short-term interest rates to combat inflation.
- Investors flock to long-term bonds as a safe haven, driving down their yields.
- Market participants foresee a future decline in inflation and interest rates.
Understanding these mechanics is crucial for interpreting the curve’s signals. It’s not just about the inversion itself, but the underlying economic forces driving it.
Historical Predictive Power
The 3-month Treasury yield curve has a robust history as a recession predictor. Since the 1950s, every U.S. recession has been preceded by an inversion of the 3-month/10-year Treasury yield curve, with only one false signal in the mid-1960s. This impressive track record gives it significant weight in economic forecasting.
This section has laid the groundwork for understanding what the 3-month Treasury yield curve is and why its movements are so closely watched. Its historical accuracy as an economic harbinger makes it an indispensable tool for anticipating future market conditions and economic downturns.
Current State of the Yield Curve and Market Sentiment
As we navigate the current economic landscape, the state of the 3-month Treasury yield curve offers critical insights into prevailing market sentiment and expectations. Recent movements in both short-term and long-term rates reflect a complex interplay of inflationary pressures, Federal Reserve policy, and global economic dynamics.
In the present environment, we’ve observed periods of significant inversion, primarily driven by the Federal Reserve’s aggressive interest rate hikes aimed at taming persistent inflation. This policy response has pushed short-term rates higher, often surpassing long-term yields, as the market grapples with the implications of tighter monetary conditions.
Factors Influencing the Current Curve
Several key factors are currently shaping the yield curve:
- Federal Reserve Policy: The Fed’s stance on interest rates and quantitative tightening directly impacts short-term Treasury yields.
- Inflation Expectations: Market participants’ views on future inflation influence both short and long-term bond demand and pricing.
- Global Economic Health: Geopolitical events and the health of major global economies can drive safe-haven demand for U.S. Treasuries, affecting yields.
These elements combine to create a dynamic environment for bond markets, making constant monitoring essential.
Market Sentiment and Investor Behavior
The current yield curve reflects a cautious market sentiment. Investors, anticipating a potential economic slowdown or even a recession, are increasingly seeking the safety of long-term government bonds. This increased demand for long-term debt helps to suppress their yields, further contributing to or exacerbating an inversion.
Conversely, the higher short-term rates reflect the immediate cost of borrowing and the Fed’s commitment to price stability. This divergence in sentiment between short and long-term outlooks is the essence of a yield curve inversion.
The current state of the 3-month Treasury yield curve is a direct reflection of ongoing economic tensions, driven by aggressive monetary policy and evolving market expectations for future growth and inflation. Its movements continue to be a focal point for economic analysis.
The Predictive Power: What an Inversion Truly Means
The significance of a 3-month Treasury yield curve inversion extends far beyond a simple chart pattern; it is a powerful economic signal with a remarkable track record. While not an absolute guarantee, its consistent ability to precede economic downturns makes it one of the most closely watched indicators by economists and investors.
An inversion signals that the bond market expects future economic conditions to be weaker than current ones. This can manifest in several ways, from a slowdown in corporate profits to increased unemployment and reduced consumer spending. The market essentially prices in a future where interest rates will need to be lower to stimulate a struggling economy.
Recessionary Signals and Lead Times
Historically, the lead time between a 3-month Treasury yield curve inversion and the onset of a recession has varied, typically ranging from 6 to 18 months. This variability means that while an inversion is a strong warning, it doesn’t provide precise timing for an economic contraction. It does, however, offer a window for businesses and individuals to prepare.
Why is it so reliable?
The reliability of the inverted yield curve as a recession predictor stems from several factors:
- Market Consensus: It reflects the collective wisdom and expectations of millions of bond market participants.
- Monetary Policy Impact: Often, aggressive Fed tightening to combat inflation leads to inversions, which then dampens economic activity.
- Lending Behavior: An inverted curve can squeeze bank profit margins on lending, potentially reducing credit availability and slowing economic growth.
These interconnected elements create a self-fulfilling prophecy to some extent, where the market’s expectation of a slowdown can contribute to it.
In essence, an inverted 3-month Treasury yield curve is more than just a data point; it’s a profound market statement about future economic health, urging caution and strategic planning among all economic actors.
Potential Economic Implications for 2025
Looking ahead to 2025, the implications of the 3-month Treasury yield curve’s current and projected movements are substantial. Depending on whether the curve remains inverted, flattens, or steepens, the US economy could face a range of scenarios, each with distinct impacts on various sectors.
Should the curve remain deeply inverted through late 2024 and into 2025, it would reinforce the market’s expectation of an impending economic slowdown or recession. This could translate into tighter credit conditions, reduced corporate investment, and potentially higher unemployment rates.
Scenario 1: Persistent Inversion
A continued inversion suggests a high probability of a recession in 2025. This would likely lead to:
- Reduced Consumer Spending: As economic uncertainty grows, consumers tend to cut back on discretionary purchases.
- Corporate Earnings Pressure: Businesses might face declining revenues and profits, potentially leading to layoffs.
- Federal Reserve Response: The Fed would likely be pressured to cut interest rates to stimulate the economy.
Such a scenario demands a defensive posture from investors and a focus on essential goods and services.
Scenario 2: Curve Normalization (Steepening)
If the yield curve begins to steepen, meaning long-term yields rise relative to short-term yields, it could signal renewed optimism about future economic growth or increased inflation expectations. This could be driven by:
- Successful Inflation Control: If the Fed’s policies bring inflation under control without triggering a severe recession.
- Stronger Growth Outlook: Market participants anticipating a rebound in economic activity.
- Increased Government Borrowing: Higher long-term supply of bonds could push yields up.
A steepening curve, especially if driven by growth expectations, would generally be a positive sign for equity markets and economic expansion.
Scenario 3: Flat Curve
A flat curve, where short and long-term yields are very similar, often indicates a period of economic transition or uncertainty. It can suggest that the market is unsure about the direction of future growth or inflation, hovering between expansion and contraction.
The economic implications for 2025 are heavily contingent on the evolution of the 3-month Treasury yield curve. Its trajectory will provide crucial clues about the magnitude and nature of the challenges and opportunities that lie ahead.
Impact on Investments and Financial Markets in 2025
The behavior of the 3-month Treasury yield curve in 2025 will undoubtedly exert a profound influence on investment strategies and financial markets. Its signals, whether indicating recession, recovery, or stagnation, will guide asset allocation decisions across various asset classes.
For investors, understanding these implications is paramount to protecting capital and identifying opportunities. Different market segments react uniquely to changes in economic outlook signaled by the yield curve.
Equity Markets
An inverted yield curve typically heralds a challenging period for equity markets. Sectors sensitive to economic cycles, such as consumer discretionary, industrials, and technology, may experience significant headwinds. Conversely, defensive sectors like utilities, consumer staples, and healthcare might offer greater resilience.
If the curve steepens due to renewed growth expectations, a broader market rally could ensue, with cyclical stocks potentially outperforming. However, if steepening is driven by uncontrolled inflation, it could still pose challenges for equities as real returns diminish.
Fixed Income Markets
Fixed income investors are directly impacted by yield curve movements. During an inversion, short-term bonds offer higher yields than long-term bonds, making them attractive for income-focused investors. However, if a recession materializes, the Federal Reserve will likely cut rates, benefiting longer-duration bonds as their prices rise.
Other Asset Classes
Commodities, particularly oil and industrial metals, tend to suffer during economic downturns signaled by an inverted curve due to reduced demand. Gold, often considered a safe-haven asset, might perform well in periods of economic uncertainty and declining real interest rates.
Key Investment Considerations for 2025
- Diversification: Spreading investments across different asset classes and geographies can mitigate risks.
- Quality Focus: Prioritizing companies with strong balance sheets, stable cash flows, and sustainable business models.
- Active Management: The ability to adjust portfolios dynamically in response to evolving market signals will be crucial.
The 3-month Treasury yield curve remains a critical compass for navigating the investment landscape in 2025, demanding close attention and thoughtful strategy adjustments.
Beyond the Curve: Other Economic Indicators for 2025
While the 3-month Treasury yield curve is an exceptionally powerful predictor, it is crucial to remember that it is one piece of a larger economic puzzle. A holistic understanding of the 2025 economic outlook requires integrating its signals with other key indicators. Relying solely on the yield curve, while informative, can lead to an incomplete picture.
Other economic data points provide context, confirm trends, or even offer counter-signals that refine the overall forecast. These indicators cover various aspects of economic health, from consumer behavior to manufacturing output, providing a comprehensive view.
Complementary Economic Indicators
To gain a more robust understanding of the 2025 economic landscape, consider these additional indicators:
- Consumer Confidence Index: Reflects consumer sentiment about current and future economic conditions, directly impacting spending.
- Purchasing Managers’ Index (PMI): Provides insights into the health of the manufacturing and services sectors.
- Unemployment Rate and Job Growth: Key measures of labor market strength, impacting consumer income and spending capacity.
- Inflation Data (CPI, PCE): Essential for understanding price stability and the Federal Reserve’s policy direction.
Monitoring these alongside the yield curve offers a multi-faceted perspective on economic trajectories.
The Role of Federal Reserve Communication
The Federal Reserve’s communications, including statements from the Federal Open Market Committee (FOMC) and speeches by its governors, are vital. These provide direct insights into the Fed’s assessment of the economy, its policy intentions, and its targets for inflation and employment. Their forward guidance can significantly influence market expectations and, consequently, the yield curve itself.
Ultimately, a comprehensive economic forecast for 2025 will weave together the predictive power of the 3-month Treasury yield curve with the corroborating evidence and nuanced insights from a broad array of other economic indicators and central bank communications. This integrated approach provides the most reliable foundation for strategic planning.
Strategic Preparedness for 2025 Economic Shifts
Given the potential signals emanating from the 3-month Treasury yield curve and other economic indicators, strategic preparedness for 2025 economic shifts is not just prudent, but essential. Proactive planning can help individuals, businesses, and investors mitigate risks and capitalize on emerging opportunities.
Whether the economy faces a slowdown, a recession, or a period of robust growth, having a clear strategy in place will be critical. This involves assessing personal and business financial health, adjusting investment portfolios, and staying informed about market developments.
For Individuals and Households
Building a strong financial foundation is key:
- Emergency Fund: Ensure you have 3-6 months of living expenses saved in an easily accessible account.
- Debt Management: Prioritize paying down high-interest debt to reduce financial vulnerability.
- Budget Review: Re-evaluate spending habits and identify areas for potential savings.
These steps provide a buffer against unexpected economic challenges.
For Businesses
Businesses should focus on resilience and adaptability:
- Cash Flow Management: Optimize cash reserves and ensure sufficient liquidity.
- Cost Control: Identify and streamline non-essential expenses.
- Diversify Revenue Streams: Reduce reliance on a single product, service, or customer segment.
- Supply Chain Resilience: Strengthen supply chains to withstand disruptions.
Agility will be a significant advantage in navigating uncertain economic waters.
For Investors
Investors should align their portfolios with potential economic scenarios:
- Asset Allocation Review: Consider adjusting exposure to different asset classes based on risk tolerance and outlook.
- Quality over Speculation: Focus on fundamentally strong companies and sound investments.
- Long-Term Perspective: Avoid knee-jerk reactions to short-term market volatility.
Strategic preparedness for 2025, informed by a deep understanding of economic signals like the 3-month Treasury yield curve, empowers all stakeholders to navigate the future with greater confidence and foresight, transforming potential threats into manageable challenges.
| Key Aspect | Brief Description |
|---|---|
| Yield Curve Definition | Difference in interest rates between short-term (3-month) and long-term (10-year) U.S. Treasury bonds. |
| Inversion Signal | When short-term yields exceed long-term yields, historically predicting recessions. |
| 2025 Implications | Potential for recession, economic slowdown, or recovery depending on curve’s trajectory. |
| Investment Impact | Guides asset allocation; affects equities, fixed income, and commodities. |
Frequently Asked Questions About the 3-Month Treasury Yield Curve
An inverted 3-month Treasury yield curve historically signals an impending economic recession. It indicates that bond investors expect future short-term interest rates to be lower than current ones, usually due to an anticipated slowdown or contraction in economic activity that would prompt the Federal Reserve to cut rates.
It is remarkably accurate. Since the 1950s, every US recession has been preceded by an inversion of the 3-month/10-year Treasury yield curve, with only one notable false signal. This strong track record makes it a highly reliable, though not perfectly timed, indicator for economic downturns.
Inversion typically occurs when the Federal Reserve aggressively raises short-term interest rates to combat inflation, making short-term bonds more attractive. Simultaneously, investors seeking safety or anticipating future rate cuts may flock to longer-term bonds, driving their yields down. These combined actions lead to short-term yields exceeding long-term ones.
An inversion often prompts a more defensive investment stance. Investors may shift towards defensive sectors in equities, increase allocations to high-quality bonds, or consider safe-haven assets like gold. It signals a need for caution and potential portfolio adjustments to mitigate risks associated with an economic slowdown.
While powerful, the yield curve should be complemented by other indicators such as the Consumer Confidence Index, Purchasing Managers’ Index (PMI), unemployment rates, inflation data (CPI/PCE), and Federal Reserve communications. A holistic view provides a more comprehensive and accurate economic forecast for 2025.
Conclusion
The 3-month Treasury yield curve remains an indispensable barometer for gauging the future health of the U.S. economy. Its historical accuracy in predicting recessions grants it significant weight, making its movements a focal point for economists, investors, and policymakers. As we look towards 2025, the curve’s trajectory—whether it remains inverted, flattens, or steepens—will offer critical insights into potential economic shifts, influencing everything from investment strategies to corporate planning. While not a standalone crystal ball, when combined with other robust economic indicators, the yield curve provides a powerful framework for strategic preparedness, enabling stakeholders to navigate the evolving financial landscape with greater clarity and confidence.


